Lending Markets
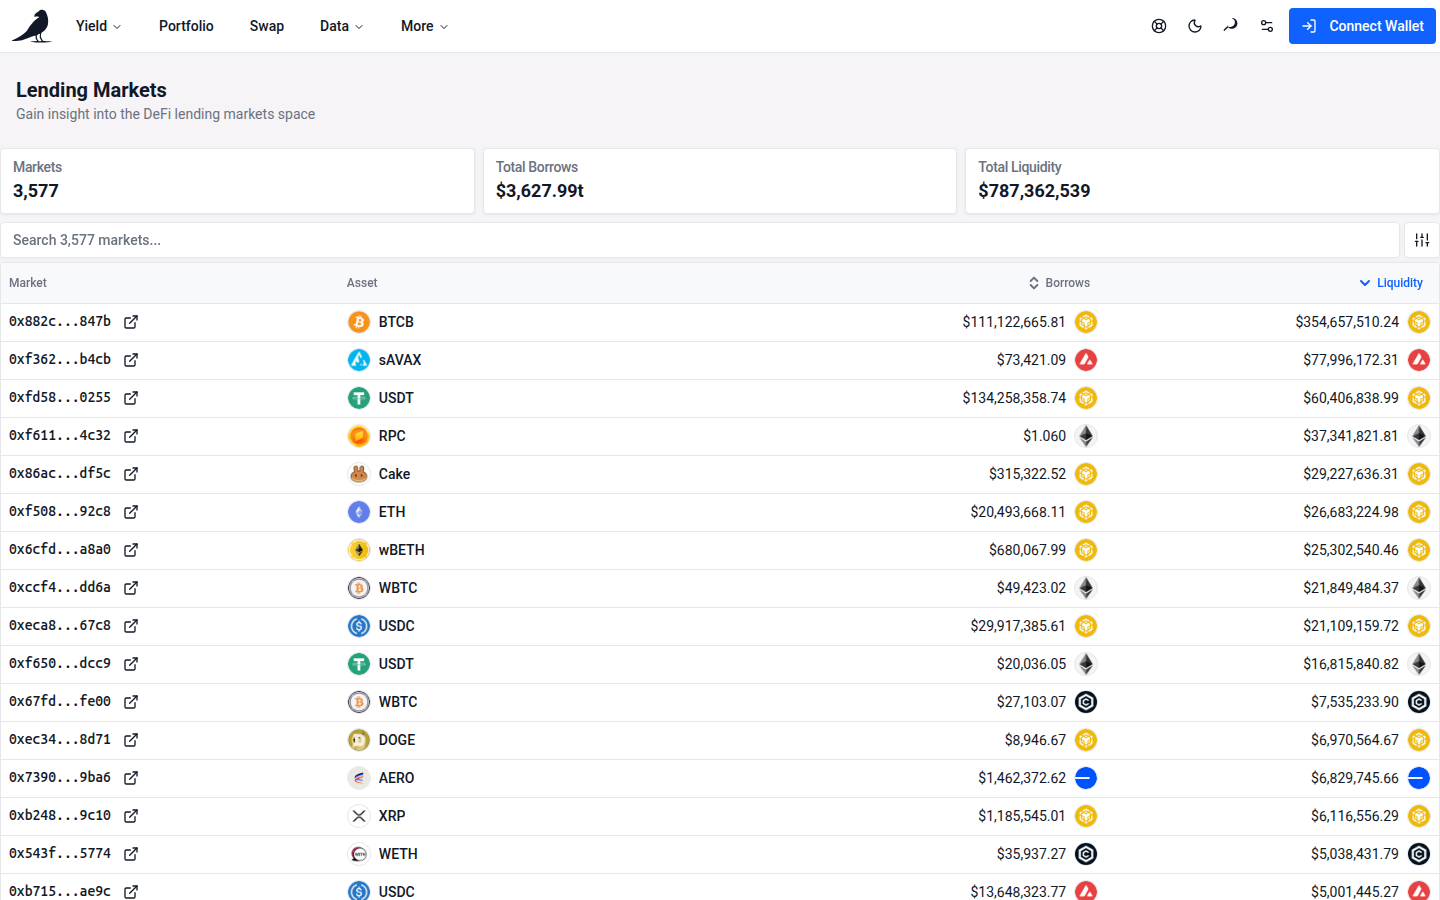
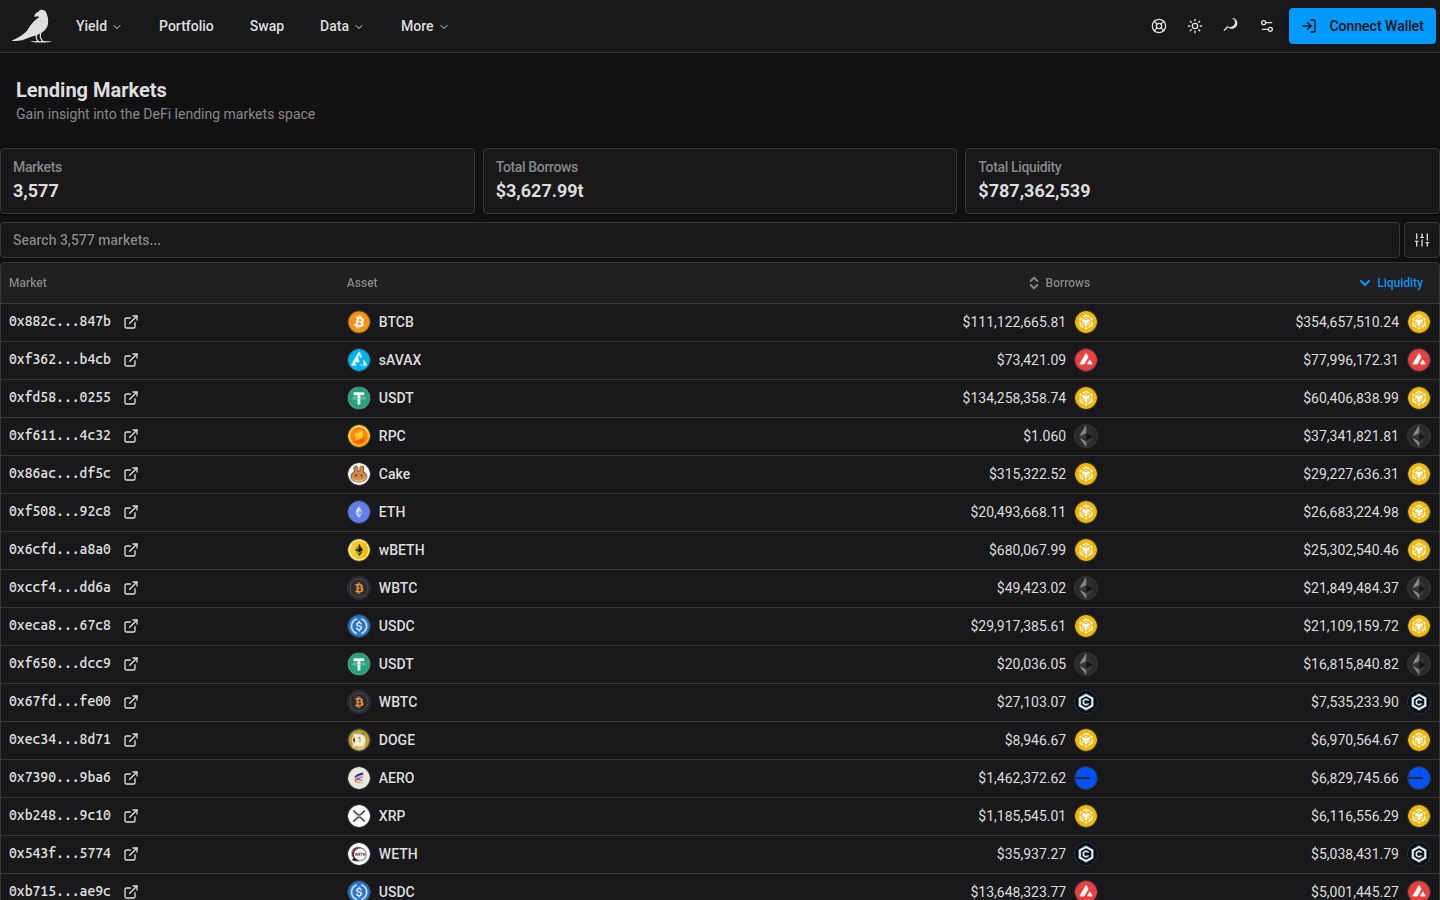
Lending Markets is a discovery and analytics page for every Compound-protocol-style lending market vfat.io indexes, across all supported chains: thousands of markets in one table.
KPIs
Three headline numbers sit above the table, aggregated server-side across every market matching your current search/chain filters, not just the rows currently loaded on screen:
- Markets: how many lending markets match
- Total Borrows: combined outstanding borrows, in your display currency
- Total Liquidity: combined available (unborrowed) supply, in your display currency
Table
Each row is one market, showing:
- Market: the market’s contract address (chain-aware, truncated) and chain
- Asset: the underlying token that market lends/borrows, with its logo
- Borrows: total borrowed against that market, with the chain logo
- Liquidity: total available liquidity left to borrow, with the chain logo
Click Borrows or Liquidity to sort by that column (defaults to Liquidity, descending). Sorting, search and chain filtering all happen server-side, so they apply across the full dataset rather than just what’s loaded. The table starts with 50 markets and shows a running “Showing X of Y markets” count with a Load more button underneath to fetch the next 50.
Filtering
- Search matches market or underlying-token names, symbols, and addresses, ignoring case. It searches every matching market, not just what’s already loaded. Open Search help for examples, and choose a chain in Filters to narrow the results.
- The filter button opens a chain picker (a dialog on desktop, a bottom drawer on mobile). Deselect chains to narrow the table down to specific networks, or click Reset Filters to go back to every chain.
Scope
This page is informational: it’s a way to compare lending market depth and utilization across chains and protocols at a glance. There’s no in-app lend/borrow/repay flow here. Use it to find where liquidity and borrow demand are concentrated, then transact on the underlying protocol directly.